TCG 2019 Economic Forecast & Investment Strategy
Part I
Triumph Capital Group 2019 Economic Forecast and Real Estate Investment Strategy: TCG Forecast
By: Paul J. Ruff, Triumph Capital Group Managing Partner
Triumph Capital Group’s analysis of economic indicators suggests a slowing economy in 2019, with a potential for recession, but a downturn that would be relatively mild in its magnitude with or without actual GDP contraction. We are also seeing some factors that could lead to an extension of growth, pushing a slowdown into 2020 or later, but trend analysis reduces the probability of delay. In addition, we see the potential for a big run- up in growth, subject to political influences in 2020, after the downturn. A continued cautious approach to investment and underwriting with a balanced risk profile is appropriate in the new year, while both aggressive growth risk postures or purely defensive postures are likely overkill.
Beware the Headlines
The news media tends to express concern about the end of the current expansionary phase of the economic cycle with headlines often used to evoke strong emotions by using words such as "the coming crisis" or "the next crash," as if it were a certainty. In addition to media’s need for hype to attract eyes, much of this attitude stems from the traditional view of an economic cycle as an "N-shaped" animal with a regular and repeated form. Incorrectly applied, this view can have the impact of over-reaction, where people defensively prepare for a crisis, which may end up costing them far more in lost opportunity. What does a real "crisis" look like? Well, a sub-prime lending collapse is one example. Regulation and restraint appear to be a governor on any massive bubbles in the current environment.
Figure 1 below represents the traditional view of the N-shaped cycle:
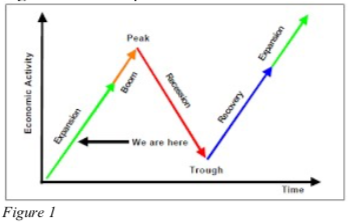
This view of an economic cycle is very simple, and generally accurate. However, it’s Achilles heel in predictive economics is that it does not account for degrees of severity. For example: if the N-shaped model were applied to the period from 1991-2005, would that be a correct application? Probably not: during that period the US endured a very mild (historically speaking) recession, or "trough" in 2001, which realistically created more opportunity than real pain for investors. The bottom right of the "N" simply didn’t reach that bottom. Later, considering the period from 2002 to (roughly) 2012 shows there was a legitimate "crash," affectionately known as the Global Financial Crisis in 2008-9, with a far more painful outcome for almost everyone. In both cases, there is very little of the discernible "N" shape in play. In fact, the 2002-2010 period looks more like a coat hook, as in Figure 2 below.
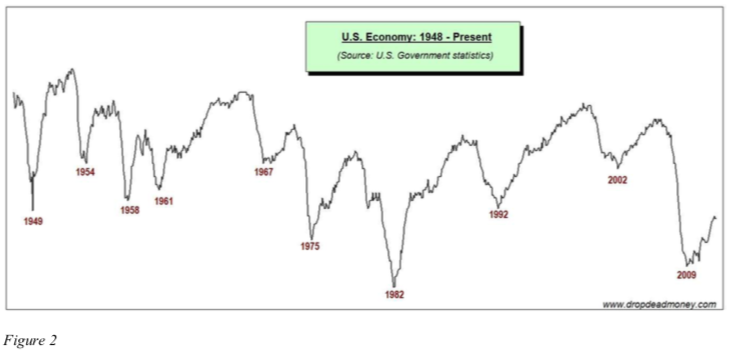
This perspective of economic volatility since WW II more clearly illustrates degrees of severity versus the simplistic view. With it, we can see that the "N-shaped" model is not the boots on-the-ground reality very often. In fact, Figure 2 reveals the reality that often, there is a relatively mild downturn in between the more serious peaks and troughs and, importantly, those milder downturns tend to follow periods of relatively long, slow growth. With US GDP growing extremely slowly, at an average of just 1.94% from 2009-2017 (versus the long-term average of 3.20% since 1948), we believe the current economy has been following this pattern.
Clearly, severity is not reflected in a simplistic model, while at the same time, it matters to how businesses need to conduct themselves. So, how do we solve for it? The economy is a complex and psychologically dependent animal, so the only good answer is to manage real-time data and take headlines for what they’re worth: hype.
Current Outlook
With the above context in mind, we see that the US economy is continuing to grow, and several key measures of the core economy continue to rise, suggesting further growth in 2019. There are several indicators experiencing a slowing rate of growth, and their trajectory suggests the economy may correct by late in the year or more likely in early 2020. This mixed bag of data may mean we are ultimately looking at a recession, or perhaps just a slowing without actual negative GDP, but not likely a "crash" or a "crisis." In fact, right about now is when we’ll probably start to hear about the possibility of a so-called "soft-landing." Of course, there are also areas of risk, some of which can be quantified.
The following factors are worthy of attention:
- The US Conference Board Leading Indicator declined in November, which was the second consecutive month of slowing, which when we look back may make September 2018 the peak for this cycle.
- Nondefense Capital Goods orders are slowing and trending toward contraction in late 2019-early 2020.
- Industrial Production growth is slowing, but not as much as was expected. November’s gain was revised upward to 0.4%, and the index rose 0.3% in December, both in line with expectations, leading to a 4Q annualized rate of 3.8%, which was down from 4.7% in 3Q. However, there was a positive surprise lurking behind the numbers: December Manufacturing Output was up 1.1%, the biggest gain in 10 months, and Capacity Utilization rose to 78.8% in December, the highest level in almost four years. These are some very strong showings. However, considering that the Purchasing Manager’s Index has been generally declining since mid-year 2018, we will likely see a declining rate of growth in Industrial Production through most of 2019.
- Private Sector Employment growth is likely to continue its bumpy but generally slowing growth pattern through the year. That said, employment growth is expected to stay positive without an actual contraction.
- Headline CPI increased 1.9% YOY in December, the first reading below 2% since August of 2017. Core Consumer Inflation (CPI adjusted for food and energy) has grown much more steadily, right at 2% YOY.These are right on target for Fed policy.
Most importantly for the US economy, Total Retail Sales are continuing to expand robustly, boosted by the overall employment picture and (finally) some growth in wages. Total Retail Sales during the 12-months through November were up 5.2% year-over-year (EOY data is not available as of this writing due to the government shutdown) and will likely also slow as we move through 2019, but it will trend more toward the 3% growth-level over the next 12-18 months rather than anywhere near contraction. After this slowing, the overall economy is likely to be expanding again considering the data mentioned above, which will add fuel for further consumer spending and potentially significant economic growth thereafter. Meanwhile, although consumer prices have increased, the near-term rate of inflation will also likely be dampened by factors at the wholesale level, as price competition sets in. Notably, e-commerce sales were up 16% in 2018 to over $525 billion; a new record.
Now let us address the risks to the potential economic growth noted above:
Risks: Stock and bond markets? Yes.
The US stock and bond market volatility, felt most poignantly in December, is being amplified by programmatic trading: computers with fixed orders, executed in massive volume. In 4Q 2018 alone, we saw the Dow drop from a high of 26,800 to a low of 21,700; a change just shy of 20%, which had it been achieved would have met the common definition of a bear market. But it has not yet. Also, in 4Q, the 10-year treasury yield spiked to over 3.23% and then dropped back down to the 2.76% level it held for most of the rest of the 2018, a very volatile 47 basis point range.
Ultimately, due to institutional influence and programmatic trading, market volatility should no longer be viewed as a reflection of true "investor sentiment." However, the impact of a market swoon on the individual investor and the psychological "wealth effect" we all feel is quite meaningful and should not be overlooked. After all, economic perceptions drive economic reality. The market’s dive caused many to wonder whether a bear market would portend a recession in the near-term, and change behavior accordingly, which could in fact then help bring on such a recession. Historical data suggest that severe market downturns don’t tend to cause economic decline, and in fact they tend to be short when GDP isn’t also on the down-swing, which it clearly is not. However, a continuance of negativity in the stock market could certainly impact consumer spending habits, which as discussed above is the "magic dust" of the US economy, so the attitude could easily have more dire consequences.
Risks: Interest Rates? Yes.
Related to the bond market discussion above, the single greatest risk to economic growth remains interest rates: how the Fed manages Federal Funds Rate policy and how Treasury markets respond. With rates appearing in check as we enter 2019, US federal debt is not a risk to economic growth right now, but it can become a risk very quickly if spikes in rates do occur. This is something to watch very closely.
Risks: Global slowdown? Yes.
There has also been a significant amount of press related to a "global slowdown" in economic activity, most poignantly in China (slowing from a rate of over 12% in 2011 to less than 6.5% in 2018), which will reverberate to the US and put further pressure on growth. It is a reality that global growth is slowing, and while nowhere near crisis levels, that should be a concern for a globalized economy like the US, particularly after finally achieving oil independence and trending fast to becoming a net-oil exporter barring a disruption in global demand. A global economic slowdown could dampen demand for US oil and create a glut, keeping prices soft, leading to slowdowns in domestic production.
Risks: Trade? Maybe.
What can we say about trade? At the risk of misinterpretation, we believe the Trump administration is doing nothing more than using tariffs as a tool in hard-ball negotiations, and that at the heart of things they are not fundamentally a tariff-oriented administration. In the end, the philosophy is about free and "fair" trade rather than being about protectionism. Our evidence is that NAFTA has been revised, positively to the US worker; we have a new positive trade deal with South Korea; a theoretical deal is in place with the European Union, subject to the question of whether they will follow through; and most importantly, China talks appear to be progressing positively as of this writing, with mounting pressure on China from their slowing economy, as exacerbated by tariffs, to make a deal. Whether talks will be successful remains to be seen, but there is no mistaking that the benefits of restructuring trade agreements toward a freer-trade objective will benefit the US economy.
Risks: Yield Curve Inversion? Maybe.
Yield-curve (the difference between 2-year and 10-year Treasury yields) inversion is not a risk by itself, but it’s legacy as an indicator of coming recessions is noteworthy. Long-term interest rates are controlled by the markets, while short-term interest rates are controlled by Fed policy. Foreign demand for Treasury bonds continues to be strong and may grow with global growth uncertainty, putting downward pressure on longs. Until recently it was assumed that shorts would continue to rise through 2019, but comments from Powell and other governors this month has left a broadly interpreted position that rate increases will pause, and odds now favor two increases in 2019 rather than four. So, the curve, while alarmingly flat, may not indeed invert. As a harbinger of each of the past 5 recessions, and most others dating to 1960, this would be good news in terms of avoiding actual GDP contraction.
Risks: Taxes? No.
The economy received a boost in 2018 from tax reform, but the economic benefit of more money in worker paychecks began to wane as the year went on. Meanwhile, businesses utilized their lower rates to hire aggressively, driving record low unemployment, and also expand investment in capital goods. Going forward, we believe that one of the most important provisions in the new law will positively impact individual taxpayers again in Spring of 2019: the increased standard deduction. We believe there is likely to be a corresponding shot in the arm to consumer spending in the middle of the year as a result. For 2019, tax policy itself does not present a risk. On the other hand, the 70% top-tier income tax rate suggestions currently making the news? That would be an unqualified disaster. Such policy has zero chance of becoming reality in 2019, but depending on election outcomes at the end of 2020, if you’re looking for a "black swan" in the future, there it is.
Conclusion
There does not appear to be a single meaningful identifiable risk factor that has the power to have recessionary implications as we enter 2019. If there is one, it is remaining hidden. Accordingly, the data shows that there may be several reasons the US economy may experience a disruption, but very likely not reaching crisis levels. 2019 has the potential to see a continuation of growth, albeit slower. That forecast, with consideration to the number of economic question marks becoming more abundant, suggests a cautious but not defensive posture as warranted.
As is typical of economic slowdowns, we anticipate an increase in opportunities in real estate equities as institutional investors become defensive and capital becomes less abundant. Prudent application of available private investment capital can begin to produce above-market returns. For further detail, please see Part II- TCG 2019 Investment Strategy, which will be issued shortly.
Popular POSTS
Logistics real estate risk in the age of COVID-19
13 January, 2021
TCG 2019 Economic Forecast & Investment Strategy
5 January, 2019
Triumph leases up Denver business center
14 February, 2017
Interested in investing in industrial real estate? Why?
31 January, 2016
The future of industrial real estate is now thanks to retail
5 February, 2014
Supply Chain
31 January, 2016
Fort Mill deal featured in Charlotte Business Journal
15 January, 2016
The Impact Of Driverless Trucks On The U.S. Warehouse Market
6 August, 2019
Are increasing tariffs impacting demand for warehouses?
19 November, 2019